It’s really very tough job for every System or Network administrator to monitor and debug Linux System Performance problems every day. After being a Linux Administrator for 5 years in IT industry, I came to know that how hard is to monitor and keep systems up and running. For this reason, we’ve compiled the list of Top 20 frequently used command line monitoring tools that might be useful for every Linux/Unix System Administrator. These commands are available under all flavors of Linux and can be useful to monitor and find the actual causes of performance problem. This list of commands shown here are very enough for you to pick the one that is suitable for your monitoring scenario.
1. Top – Linux Process Monitoring
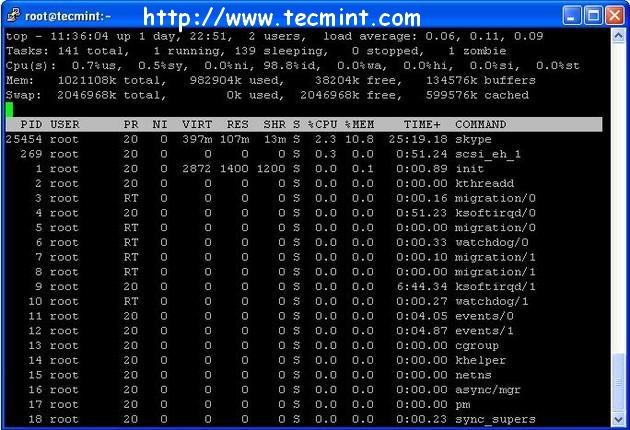
Linux Top command is a performance monitoring program which is used frequently by many system administrators to monitor Linux performance and it is available under many Linux/Unix like operating systems. The top command used to dipslay all the running and active real-time processes in ordered list and updates it regularly. It display CPU usage, Memory usage, Swap Memory, Cache Size, Buffer Size, Process PID, User, Commands and much more. It also shows high memory and cpu utilization of a running processess. The top command is much userful for system administrator to monitor and take correct action when required. Let’s see top command in action.
For more examples of Top command read : 12 TOP Command Examples in Linux
2. VmStat – Virtual Memory Statistics
Linux VmStat command used to display statistics of virtual memory, kernerl threads, disks, system processes, I/O blocks, interrupts, CPU activity and much more. By default vmstat command is not available under Linux systems you need to install a package called sysstat that includes a vmstat program. The common usage of command format is.
For more Vmstat examples read : 6 Vmstat Command Examples in Linux
3. Lsof – List Open Files
Lsof command used in many Linux/Unix like system that is used to display list of all the open files and the processes. The open files included are disk files, network sockets, pipes, devices and processes. One of the main reason for using this command is when a disk cannot be unmounted and displays the error that files are being used or opened. With this commmand you can easily identify which files are in use. The most common format for this command is.
More lsof command usage and examples : 10 lsof Command Examples in Linux
4. Tcpdump – Network Packet Analyzer
Tcpdump one of the most widely used command-line network packet analyzer or packets sniffer program that is used capture or filter TCP/IP packets that received or transferred on a specific interface over a network. It also provides a option to save captured packages in a file for later analysis. tcpdump is almost available in all major Linux distributions.
For more tcpdump usage read : 12 Tcpdump Command Examples in Linux
5. Netstat – Network Statistics
Netstat is a command line tool for monitoring incoming and outgoing network packets statistics as well as interface statistics. It is very useful tool for every system administrator to monitor network performance and troubleshoot network related problems.


No comments:
Post a Comment